About
- Open to: Full time opportunites starting from Jan 2025 and Collabrations on health care statistics
- Website: saikoushik.github.io
- Phone: +1 (669)222-9587
- City: Boston, USA
- Degree: Masters in Data Science
- College: Northeastern University, Boston
- Email: saikoushik.gsk@gmail.com
- Age: 24
Projects Delivered End-to-End Machine Learning, Deep Learning Projects Delivered
Years of Data Science Machine Learning, Deep Learning
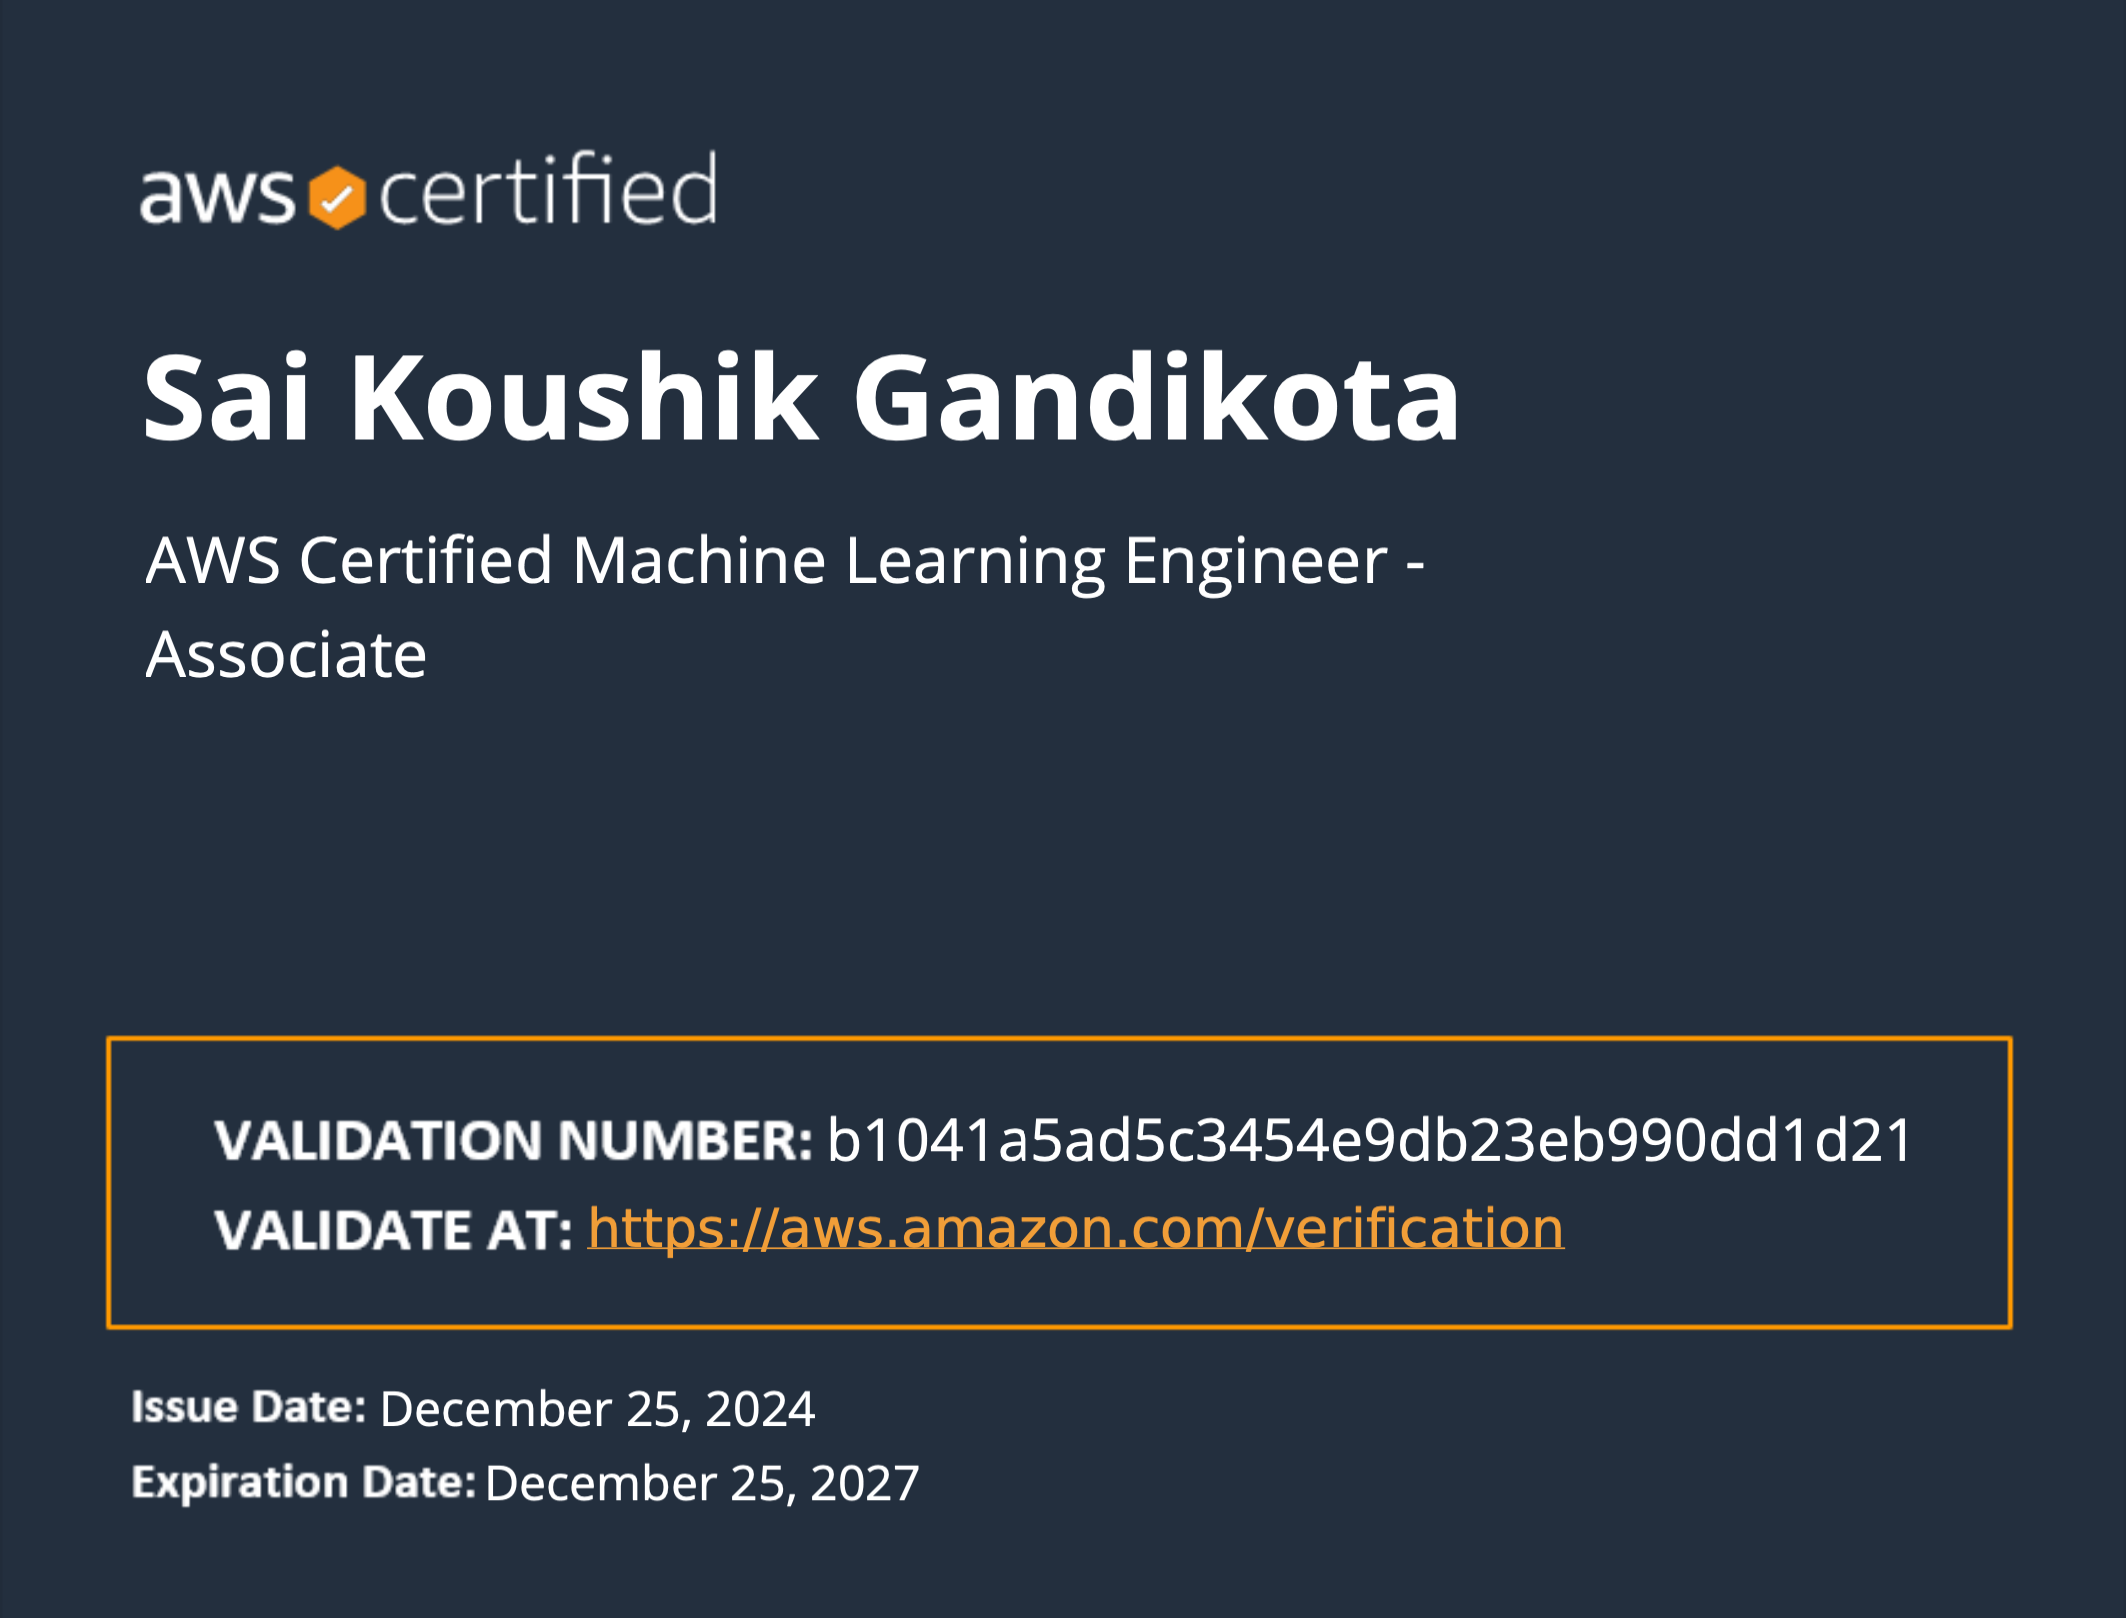
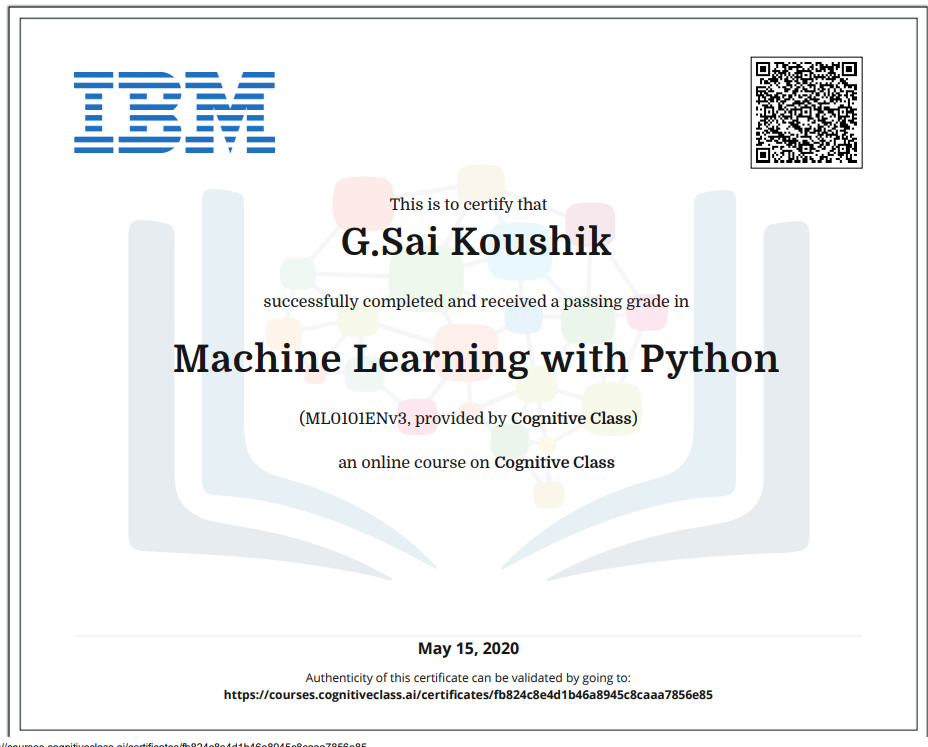
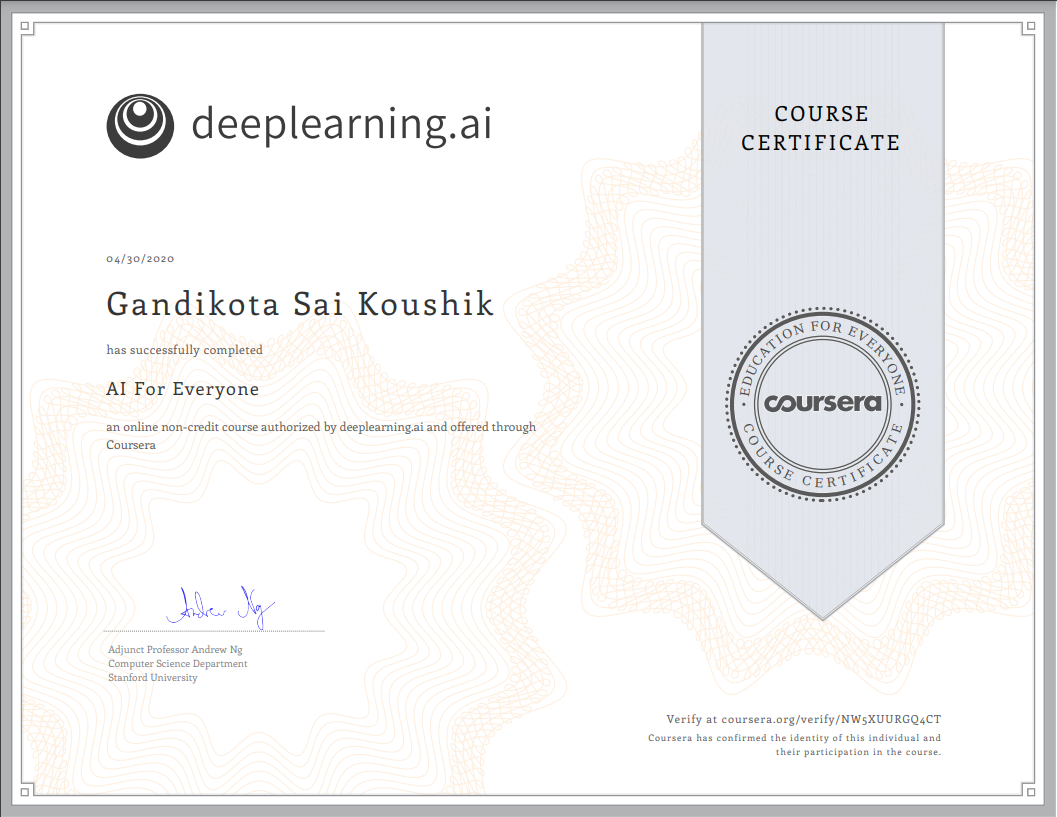
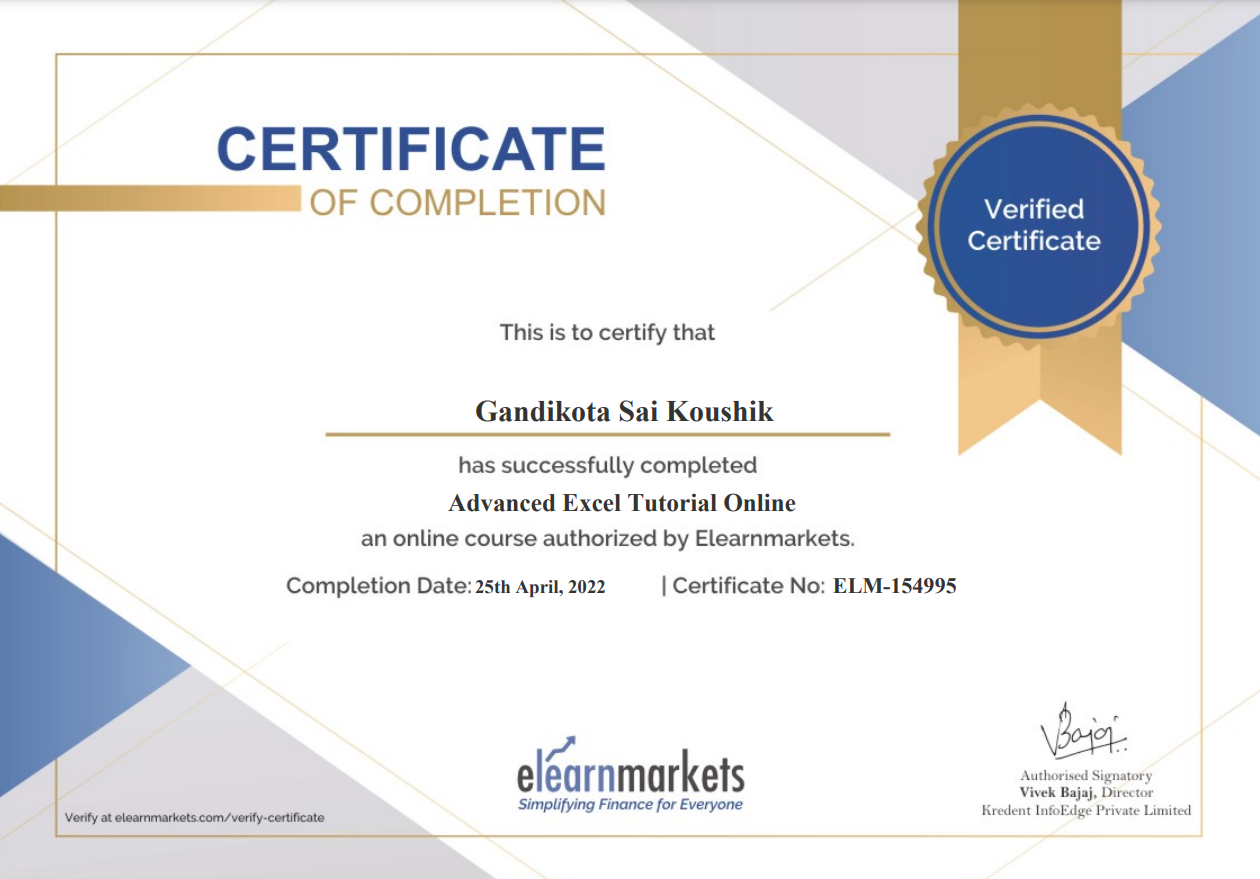
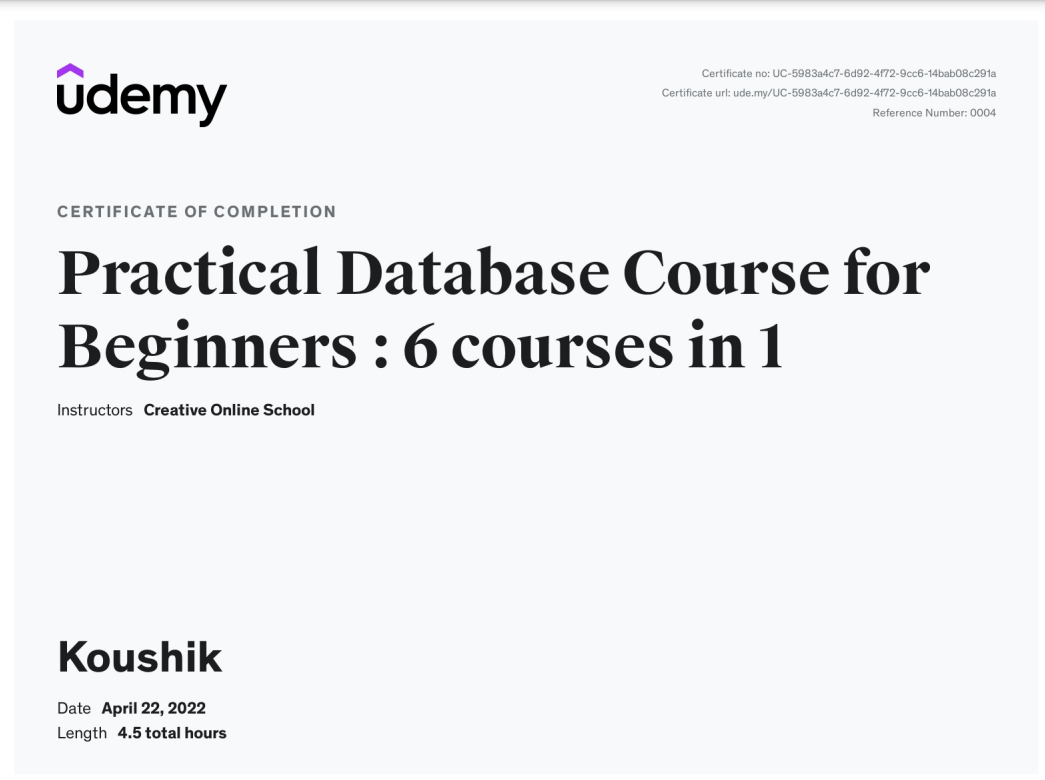
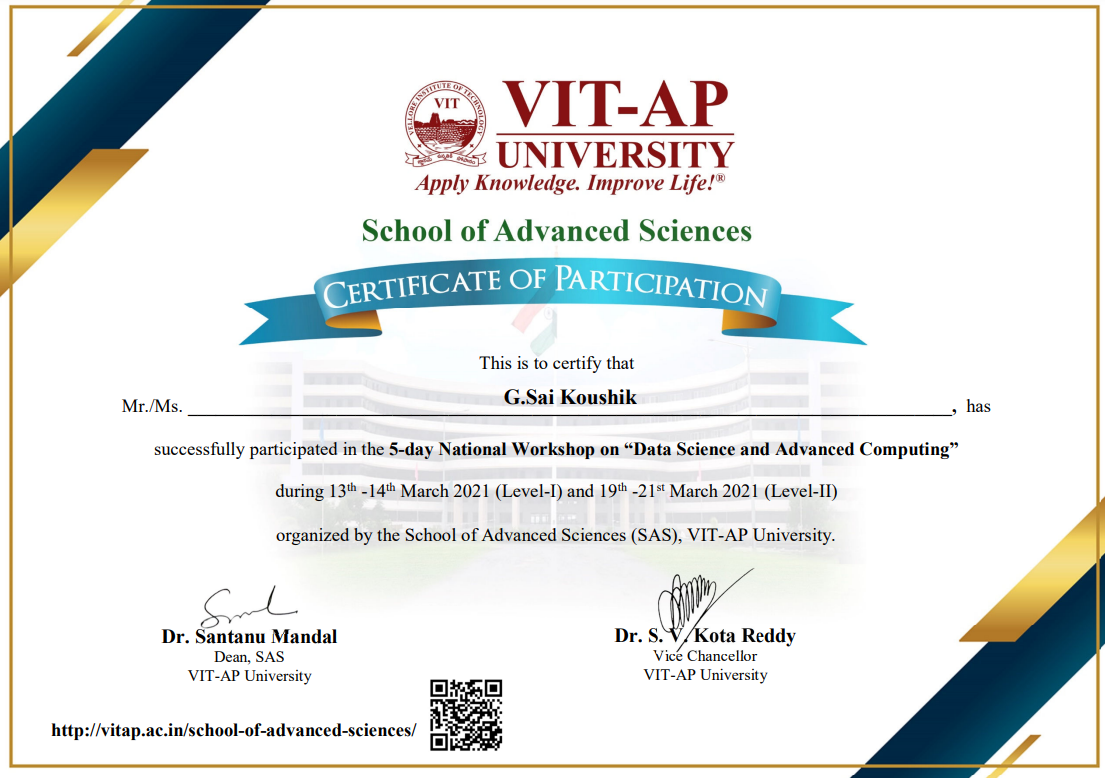
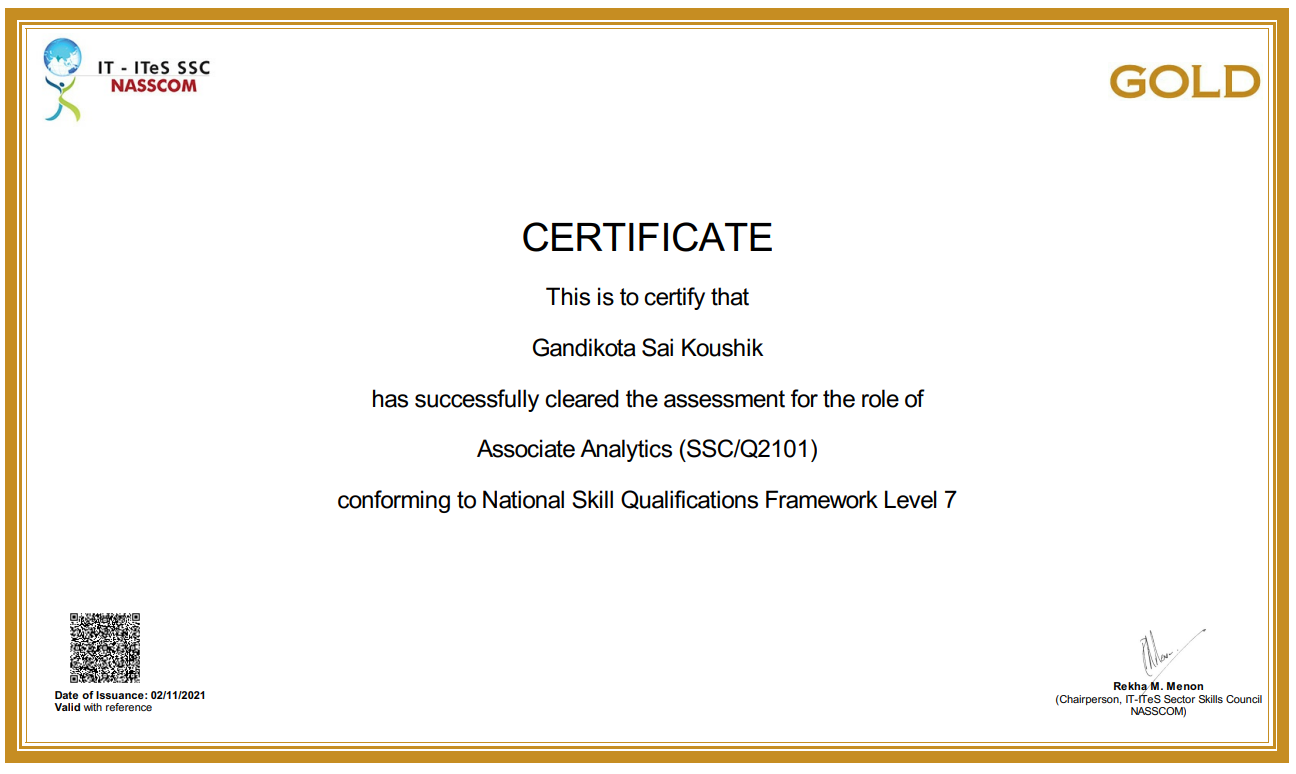
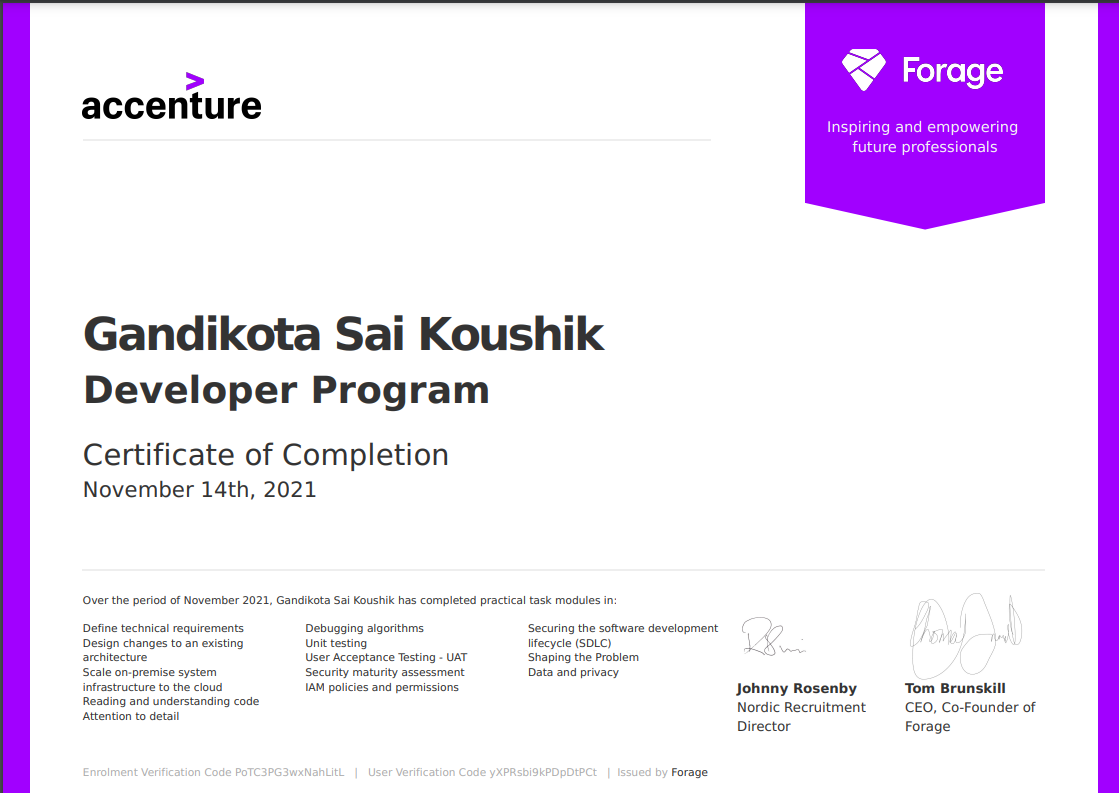
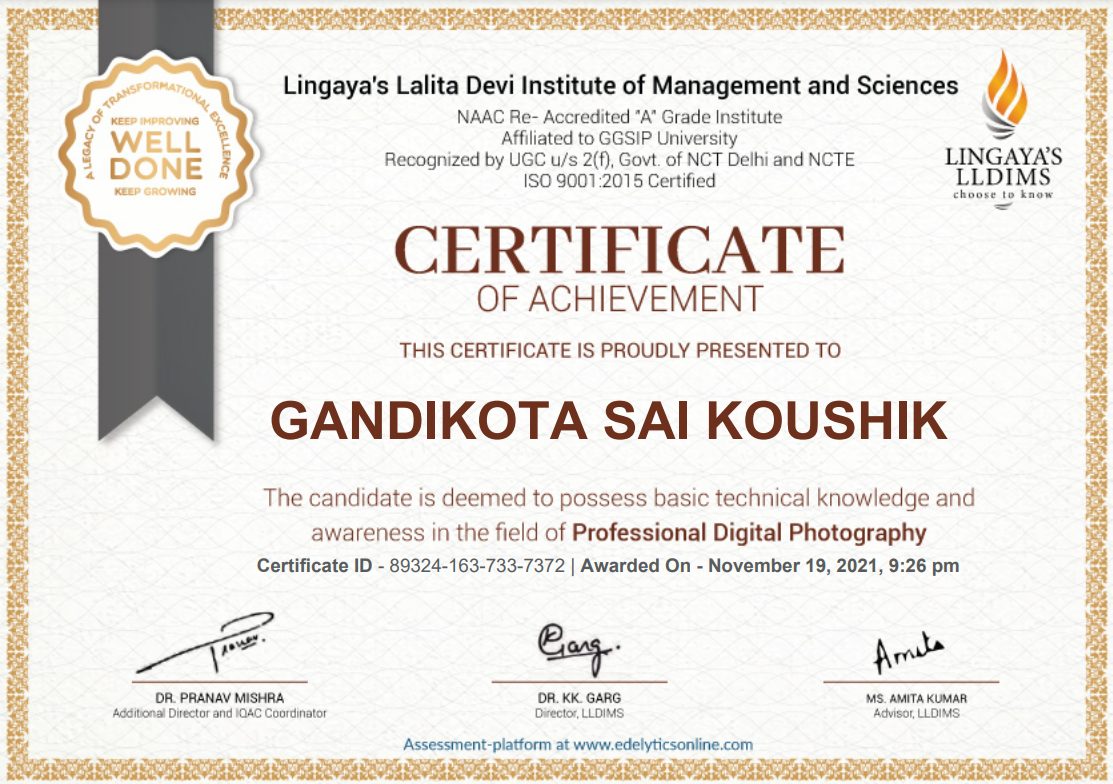
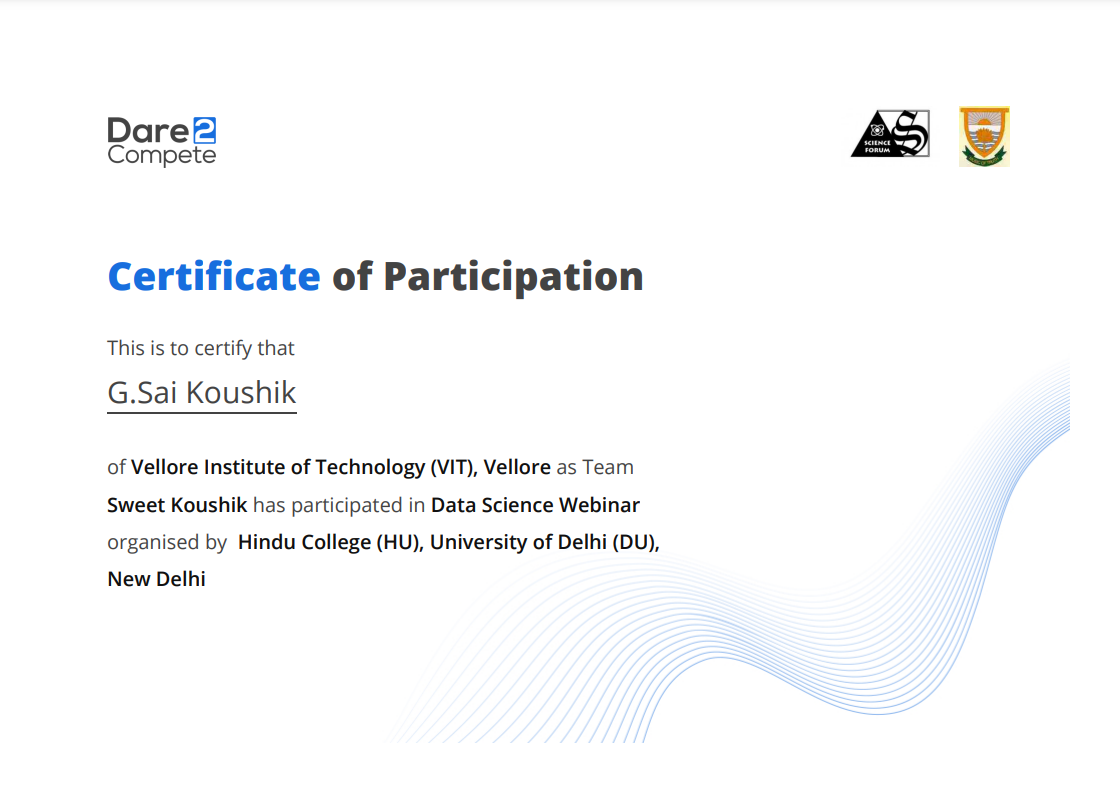
Awards & Certifications Data Science programs
Skills
Statistical Modelling:
- Proficient in applying advanced statistical modeling techniques to extract meaningful insights and uncover patterns in complex datasets
- Skilled in using R, Python for statistical analysis and hypothesis testing
- Experienced in multivariate analysis, regression analysis, and time series analysis to uncover relationships and trends in data
- Expertise in experiment design for hypothesis validation and performance evaluation
- Capable of statistical inference to draw meaningful conclusions and make data-driven recommendations
Data Analysis:
- Extensive experience in performing exploratory data analysis (EDA) to gain insights into complex data sets
- Proficient in using advanced statistical techniques and data visualization tools such as Pandas, NumPy, Seaborn, and Tableau to identify patterns and trends
- Experienced in data wrangling, data cleaning, and feature engineering to prepare data for analysis
- Well-versed in designing and implementing machine learning models to create predictive models that can help businesses make informed decisions
Data Modeling and Dashboard Creation:
- Experience in building complex data models that can provide insights into business operations
- Proficient in using data modeling tools such as ERwin, PowerDesigner, and SQL Developer Data Modeler to design efficient and effective data models
- Experience in building interactive dashboards using tools like Microsoft Power BI, Tableau, and Google Data Studio
- Can create visually appealing and informative dashboards that can help businesses make data-driven decisions
What most colleagues and fellow peers like about me?
I excel at transforming raw data into compelling narratives that resonate with stakeholders. From boardroom presentations to coffee-break chats, I ensure the story behind the numbers is not just understood but appreciated (and sometimes applauded).
Whether it’s automating redundant tasks or applying cutting-edge machine learning techniques, I thrive on creating efficient solutions that make everyone's lives easier—and our models smarter.
Collaboration is my middle name (well, not officially). I enjoy brainstorming with the team and simplifying complex concepts for everyone. Plus, I know just when to drop a perfectly-timed data joke—"Why was the data scientist always calm? They knew how to handle outliers."
Monitoring data quality
Generating and delivering quality reports to customers and performing quality assurance checks on reports.
Evaluating BI software
Evaluating and improving existing BI systems and Conducting troubleshooting on BI models.
Writing relational and multidimensional database queries.
Allow users to ask analytical questions related to business or market trends.
Use Data warehouse for big data
Using warehouse data to generate reports to support business decision making and business performance monitoring.
Portfolio
I’ve gone through a number of phases in my career, and each of them has informed my current work ethos and philosophy. I have excelled in a number of data domain roles in diverse industries, and believe that my number one asset is my ability to adapt to any challenge that is thrown my way.
- All
- Machine Learning and Deep Learning
- Data Management
- Data Visualization
Resume
Download CVSummary
Sai Koushik Gandikota
Data analyst with extensive experience in statistical analysis, data visualization, and machine learning. Skilled in Python, SQL, and other data analysis tools, with a proven ability to translate complex findings into clear, actionable insights for both technical and non-technical audiences. Eager to expand knowledge in data science and make impactful contributions to the field.
- Currently pursuing a Master's in Data Analytics Engineering at Northeastern University, Boston.
- Completed Bachelor of Technology in Computer Science with a specialization in Data Analytics from Vellore Institute of Technology, 2022.
- Experience in data analysis, data visualization, statistical analysis, machine learning, NLP, and deployment, demonstrating strong attention to detail and teamwork with excellent communication skills.
- Passionate about exploring the latest technologies in machine learning and data science, seeking opportunities to contribute and grow within the ML community.
Education
Master of Science (MS) in Data Analytics Engineering
2022 - 2024
Northeastern University, Boston
Grade: 3.96/4.0
Relevant Coursework: Data Mining, Data Management for Analytics, Computation & Visualization, Engineering Probability & Statistics
Bachelor of Technology in Computer Science and Engineering (Data Analytics)
2018 - 2022
Vellore Institute of Technology
Grade: 3.8/4.0
Relevant Coursework: OOP, Data Structures, Algorithms, Computer Networks, Operating Systems, Database Management, Computer Architecture, Mathematics
Professional Experience
Statistician
Sep 2024 - Present
Statistics Without Borders
- Conducted hypothesis testing and feature selection on 69 features, identifying 7 lifestyle risk factors for cardiovascular disease (CVD).
- Performed exploratory data analysis (EDA) in Python, extracting 23 insights and presenting findings to postdoctoral researchers, assisting in their publication.
- Developed a Logistic Regression model, achieving an 89% F1 score and interpreting feature coefficients to provide actionable insights.
Data Scientist
Jan 2024 - Jun 2024
Mass General Brigham
- Collaborated with Harvard Ph.D. professors and psychiatrists on predictive modeling and hypothesis testing to investigate PTSD, developing Random Forest and Logistic Regression models that achieved a 91% F1 score in classifying PTSD cases.
- Employed Odds Ratio and Lasso Regression to distill 9 key features from an initial set of 89 predictors for focused analysis, and used Hypothesis Testing and Bayesian networks to answer causality questions for domain experts.
- Integrated AB Testing to evaluate modes of delivery, deriving 4 key insights for improved healthcare outcomes.
Data Analyst Intern
Jan 2022 - Jun 2022
Hyderabad, India
- Optimized an ETL supply chain pipeline using Airflow on AWS, reducing processing time from 6.4 minutes to 4.8 minutes. Loaded data into Snowflake for ad hoc analysis.
- Developed an Inventory Management System using Flask with real-time stock monitoring, reducing stockouts by 30% and optimizing inventory levels across 200+ SKUs, resulting in a 15% decrease in holding costs.
- Utilized SQL for ad hoc analysis to identify key customer segments and design targeted marketing campaigns, leading to a 22% increase in revenue and a 37% rise in profitability from the previous quarter.
- Created 4 interactive dashboards and 13 key performance indicators (KPIs) in Tableau, facilitating effective communication with non-technical stakeholders.
Skills
Contact
Data is only as useful as your ability to understand it correctly, and a team that understands data makes better data-driven decisions. I can help in selecting the right tool and build solutions for data interpretation. Let's get in touch!
Location:
Everett, Massachusetts
Email:
saikoushik.gsk@gmail.com
Call:
+1 669 222 9587

